As noted in a previous post, a Freedom of Information Act (FOIA) request was filed asking for a list of the Serial Numbers of all publicly available applications where an appeal brief was filed by the Applicant, the brief filed between March 1, 2014 and March 1, 2015, including an indication of whether prosecution was re-opened. The USPTO recently provided an electronic excel file with the requested information including certain codes for the types of actions taken responsive to the brief.
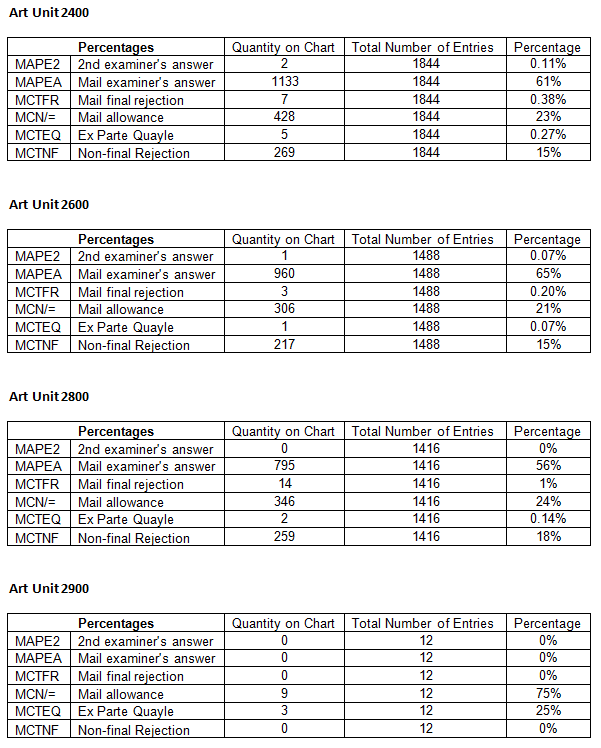
To process the raw data, only cases with one of the following actions were considered: an examiner’s answer, a 2nd examiner’s answers, a final rejection, an allowance, an ex parte Quayle action, and a non-final rejection. The tables below show the overall data, as well as data by art unit.
Looking just to the data overall, there is a relatively large number of cases (approximately 34%) where the appeal brief results in overcoming at least some rejections (either through allowance or re-opening of prosecution with a new non-final rejection). While this illustrates a strong incentive to appeal, it raises the question of the huge waste of resources being poured into what should be unnecessary appeals of what are admittedly improper or incomplete rejections. First there is the cost of appeal – with large entity government fees of $800 for a notice of appeal, and the average attorney cost of an appeal brief of somewhere in the neighborhood of $4,000 (according to the AIPLA survey). Second, consider the amount of time spent by the USPTO in redoing work and having wasted time issuing improper rejections. From the data below, in one year this amounts to almost 5,000 admittedly improper rejections (and this does not even count the many others that were never appealed, or those cases where prosecution was re-opened or the case allowed responsive to a pre-appeal brief conference).
Comparing the various art units, there is some spread in the data. The cases where an Examiner’s answer was actually mailed ranged from 56% - 71%. The cases where the appeal resulted in allowance ranged from 13% – 24%. The cases where a new, non-final rejection resulted ranged from11% - 18% of total responses.
More to come on this hot topic.